
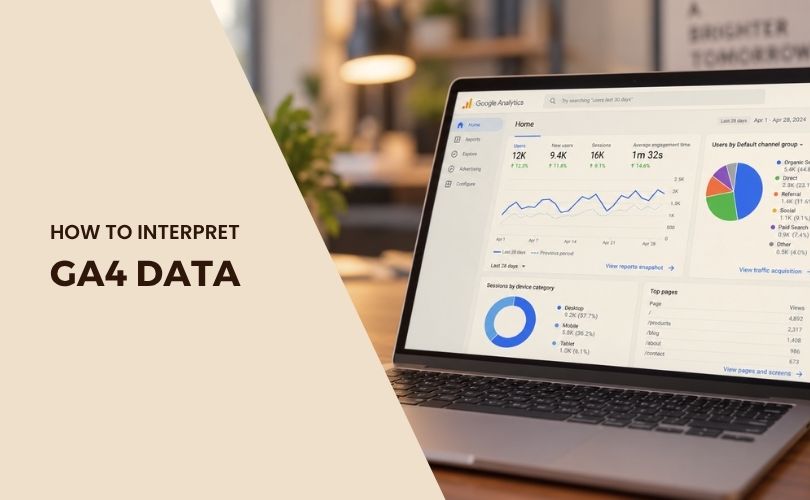
Google Analytics 4 (GA4) gives you a huge amount of data, but it doesn’t explain what any of it means for your business. That’s the part most guides skip.
This post breaks down how to read GA4 data and how to interpret Google Analytics data by report category, what each metric actually tells you, and what to do once you understand it. If you’ve tried to interpret GA4 data on your own and gotten stuck, this is built to walk you through it report by report instead of throwing every metric at you at once.
If you are planning a website or have a website but doesn’t have a GA4 installed yet, here’s why google analytics matter: it’s the only free tool that shows you where your visitors come from, what they do on your site, and where they drop off before converting. Guessing costs you money. Once you know how to read Google Analytics correctly, every decision after that gets easier.
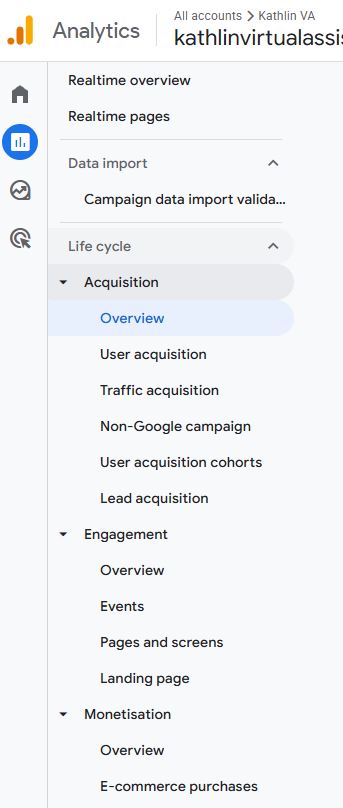
We’ll go through seven categories: User Acquisition, Traffic Acquisition, Non-Google Campaigns, Lead Acquisition, Events, Pages and Screens, and Landing Pages. By the end, you’ll be able to open your Google Analytics insights report (or GA4 insights report, same thing) and actually know what you’re looking at.
Every GA4 report is built from two types of data.
Dimensions describe your data. Examples include country, device, session source, and page title.
Metrics measure your data. Examples include users, sessions, views, and conversions.
A report combines the two. “Sessions by country” tells you how many sessions (metric) came from each country (dimension). Once this clicks, every report in GA4 stops looking like a wall of numbers and starts looking like a sentence you can read.
One more thing before the categories: GA4 runs on an events based model. Every single interaction on your site, a page load, a click, a form submission, gets logged as an event. This is different from the old Universal Analytics, which tracked sessions and pageviews as separate structures. You don’t need to memorize this to use GA4, but it explains why “Events” shows up as its own report category later in this guide, and why it sits underneath almost everything else you’ll read.
User Acquisition answers one question: when someone visited your site for the very first time, what brought them there?
This report groups every user by their first touch channel and keeps them there, even if they come back next month through a different channel. If someone found you through an Instagram post in January and returns through a Google search in March, User Acquisition still credits Instagram, because that’s how they were originally acquired.
Key metrics to look at:
How to read it: Look at which channel brings in the most new users first, then check engagement rate right next to it. A channel that brings in a lot of users but has a low engagement rate is pulling in traffic that doesn’t stick. That’s usually a sign the messaging on the ad, post, or link doesn’t match what the landing page actually delivers. A channel with fewer users but a high engagement rate and strong key events is worth more attention and more budget, even if the raw numbers look smaller.
Why this matters for your business: User Acquisition tells you which channel is actually building your audience long term, not just which one is driving traffic this week.
This is the report most people confuse with User Acquisition, and the difference matters.
Traffic Acquisition looks at every single session, not just the first one. If the same person visits your site through an Instagram post on Monday and comes back through a Google search on Thursday, both sessions get counted and credited to their respective channel here. This report resets attribution at the session level instead of locking it to the very first visit.
Key metrics to look at:
How to read it: Use this report to understand which channels are driving return visits and ongoing activity, not just first impressions. If Organic Search shows a high number of sessions with strong engagement, that’s a solid sign your SEO content is doing its job consistently, not just the first time someone lands on it. If Direct traffic is unusually high, that often means people are typing your URL from memory or clicking a link that isn’t tagged properly (more on that in the next section).
Why this matters for your business: Traffic Acquisition shows you the health of your channels over time. User Acquisition tells you who found you first. Traffic Acquisition tells you who keeps coming back, and through which door.
This report is the one most small business owners never open, and it’s often where the real gaps show up.
GA4 automatically tracks Google Ads campaigns in detail because Google Ads connects directly to Analytics. Everything else, your email newsletters, Facebook and Instagram posts, affiliate links, YouTube video descriptions, influencer collaborations, only shows up correctly here if you tagged the links yourself using UTM parameters.
A UTM parameter is a short tag added to the end of a URL that tells GA4 exactly where a click came from. For example: yourwebsite.com/services?utm_source=facebook&utm_medium=social&utm_campaign=august_promo
Without that tag, a click from Facebook can show up as “Direct” or “Referral” instead of being credited to Facebook at all, which quietly throws off every other report in this guide.
Key dimensions to check:
Key metrics to pair with them:
How to read it: Compare campaigns against each other using the same metrics you’ve already learned. A campaign with a lot of clicks but no key events isn’t converting. A campaign with fewer clicks but a strong key event rate is working harder per visitor. If you’ve been posting on social media or sending newsletters without tagging your links, this report will look empty or misleading, and that’s your signal to start tagging every outbound link going forward.
Why this matters for your business: This is the report that proves (or disproves) whether your non-Google marketing efforts are actually paying off. Without UTM tagging, you’re spending time on content you can’t measure.
If your business runs on inquiries, bookings, quote requests, or consultation calls instead of direct online sales, Lead Acquisition is the report that matters most to you.
This isn’t a single default report the way User Acquisition is. It’s built from the key events you’ve set up around lead generation, things like form submissions, calendar bookings, phone number clicks, or WhatsApp button clicks. GA4 doesn’t know what counts as a “lead” for your business until you tell it, by marking the relevant event as a key event in your property settings.
What to set up first, if you haven’t already:
Key metrics to look at once these are tracked:
How to read it: Cross reference this with your User Acquisition and Traffic Acquisition reports. A channel that brings in a large volume of users but a low lead conversion rate needs a better offer, a clearer call to action, or a landing page that actually matches what was promised in the ad or post. A channel with fewer visitors but a strong lead conversion rate is worth scaling first, since you already know it works.
Why this matters for your business: Traffic without leads is just a number that makes you feel busy. Lead Acquisition is where you find out if your marketing is actually generating business, not just clicks.
Every interaction in GA4 is an event, which makes this report the most detailed one you have access to.
Some events are tracked automatically the moment you install GA4: page_view, session_start, first_visit, scroll, and click (for outbound links) are all collected without any extra setup. Others need to be configured, either through Google Tag Manager or GA4’s built in event tracking, if you want to measure something specific like a video play, a PDF download, or a form field interaction.
Key metrics to look at:
How to read it: Look for patterns, not just totals. If your scroll event shows most visitors are scrolling past 90% of a page, that page is holding attention. If a click event on your “Book a Call” button has a high count but your Lead Acquisition report shows few actual bookings, something is breaking between the click and the completed action, worth checking the booking page itself for friction. Sudden spikes or drops in specific events are also worth investigating. They often point to a tracking issue (a code that broke after a site update) before they point to an actual change in visitor behavior.
Why this matters for your business: Events are the closest thing GA4 gives you to watching someone use your website in real time. They tell you what people actually do, not just where they landed.
This report tells you how each individual page on your site is performing, which makes it one of the most practical reports for anyone doing content or SEO work.
Key metrics to look at:
How to read it: Sort by views first to see what’s getting the most traffic, then check average engagement time next to it. A page with high views and low engagement time usually means people are landing there and leaving quickly, which is worth investigating: is the content actually answering what brought them there? A page with lower traffic but strong engagement time and key events is often underpromoted; it’s doing its job well, it just needs more visibility through internal links, social sharing, or search visibility.
Why this matters for your business: This report tells you which pages deserve more investment (updating, expanding, promoting) and which ones need to be rewritten or retired. If you’re working with an seo strategist, this is usually one of the first reports they’ll pull, since it shows exactly which content is earning its place on your site and which isn’t.
Landing Pages is a subset of Pages and Screens, but it’s worth treating as its own category because it isolates the entry point specifically, the very first page someone sees when they arrive from an external source. That distinction matters. A page can perform well overall in the Pages and Screens report while still performing poorly as a landing page, because people are only arriving there after already browsing your site, not landing there cold from a search result or ad.
Key metrics to look at:
How to read it: This report is one of the clearest ways to measure SEO and ad performance at the page level, since it shows how well each page performs specifically as a first impression. A landing page with a lot of sessions but a low engagement rate is usually mismatched with what brought people there, wrong keyword intent, a misleading ad, or a headline that promises something the page doesn’t deliver. A landing page with a strong engagement rate and solid key event rate is a page worth replicating the structure of for other content.
Why this matters for your business: If you’re running ads or publishing SEO content, this report tells you which entry points are actually converting visitors into leads or customers, and which ones are burning traffic without a return.
Interpreting GA4 data isn’t about memorizing every metric. It’s about knowing which report answers which question, and checking them against each other instead of in isolation.
None of these reports mean much on their own. The value comes from cross referencing them: a channel from User Acquisition against its key event rate in Lead Acquisition, a page’s traffic in Pages and Screens against its entry performance in Landing Pages. Once you start connecting these dots, GA4 stops being a wall of confusing charts and starts becoming a tool that tells you exactly where to focus your time and budget next.
If this is still a lot to track on top of actually running your business, that’s a normal reaction, and it’s exactly the kind of work an seo strategist handles so you don’t have to piece it together yourself every month.
Reading your GA4 reports tells you what’s happening on your site. It doesn’t tell you why the numbers look the way they do. If your Traffic Acquisition report shows healthy sessions but your Lead Acquisition numbers stay flat, that’s usually not a tracking problem, it’s a sign one of the foundations behind that traffic isn’t fully in place yet. The Organic Marketing Starter Kit walks through the five things worth setting up before you create another piece of content, so the traffic you’re now able to read actually turns into something.